Hormuz Closure Drives Suez Canal Traffic Surge: 529 Tankers in April 2026

529 Oil Tankers in One Month: Data Revealing the Scale of Shift
April 2026. The Suez Canal logged 529 transits of oil and gas tankers, up 28% compared to April 2025. When counting all vessel categories, a total of 1,182 units passed through the waterway separating Africa from the Sinai Peninsula, which is 14% more than the same period last year. Bloomberg reported this data on June 10, 2026.
Those figures are not the result of a Suez Canal Authority marketing strategy. This is the mechanical response of the market to one fact: the Strait of Hormuz is no longer passable with safety. When the main exit door for Middle Eastern oil closes, the alternative route that loops through Egypt suddenly becomes the only viable option for most energy cargo from the Gulf region.
A shift at this scale has never occurred in modern energy shipping history. The "Hormuz completely closed" scenario used to be just exercise material in geopolitical stress-tests, not operational reality that global tanker fleets had to respond to in real time. As it turns out, theory became reality.
Hormuz: A Choke Point That Is No Longer Theory
The Strait of Hormuz is a waterway segment less than 55 kilometers wide at its narrowest point, situated between Iran to the north and Oman to the south. Under normal conditions, this waterway is the mandatory route for nearly all crude oil exports from Saudi Arabia, the United Arab Emirates, Kuwait, Iraq, Qatar, and a portion of Iran's own exports.
Based on historical data from the Energy Information Administration (EIA) before this crisis, oil flows through Hormuz ranged from 17 to 21 million barrels per day, representing roughly 20% of global oil consumption. Qatar, which dominates the global LNG market, also depends on nearly all of its exports to Asia and Europe passing through the same route.
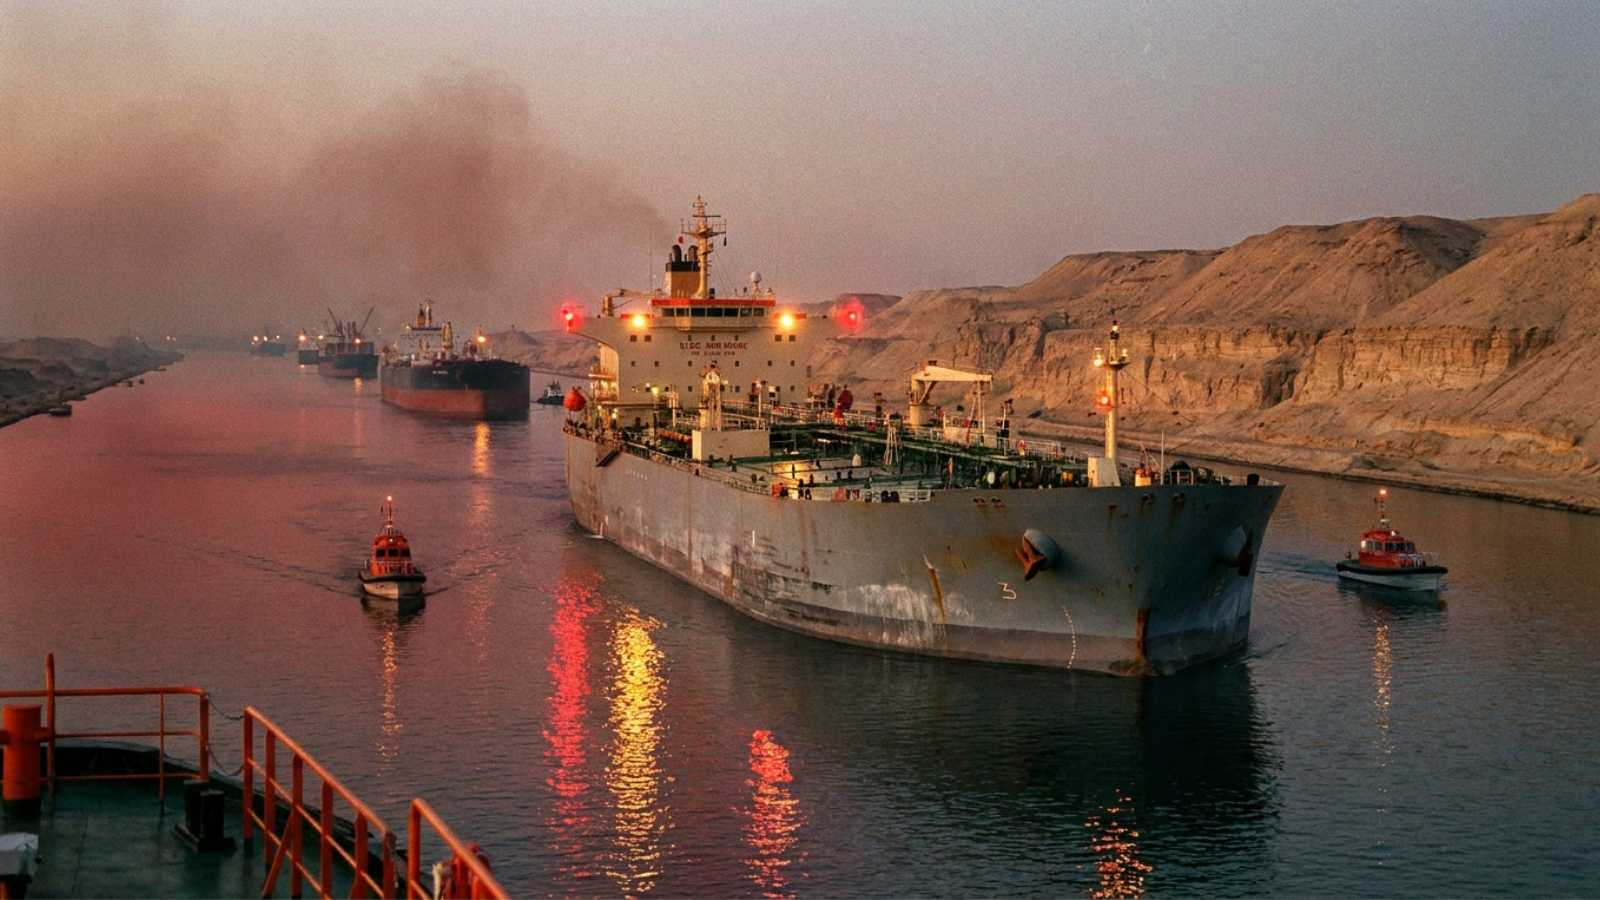
The Suez Canal recorded 529 tanker transits in April 2026, up 28% year-on-year, marking the largest surge in tanker traffic in recent years as a direct result of the Strait of Hormuz closure. (Bloomberg, June 10, 2026)
When the closure occurred in 2026, major energy importers like Japan, South Korea, India, China, and European nations importing LNG from Qatar all faced a situation requiring deep recalculation. The remaining options essentially divided into 3: wait for Hormuz to reopen, redirect the route via the Cape of Good Hope at the southern tip of Africa, or utilize existing pipeline capacity and alternative terminals in the region. The Suez Canal, together with the SUMED pipeline (Suez-Mediterranean Pipeline) running parallel to the canal, became the first option eyed by nearly all operators. The result is reflected directly in the April 2026 figures.
The Mechanism of Shift: How Those 529 Tankers Arrived at Suez
To understand this surge, one must first grasp the geography of Gulf energy shipping. Most crude oil exported by Saudi Arabia to Asia has traveled through Hormuz, then sailed east toward ports in India, China, Japan, and South Korea. With that route closed, 2 options remained.
First, vessels sail in a detour via the Cape of Good Hope. This adds very significant distance because ships from Saudi Arabia must circle the entire east coast of Africa before reaching their destination ports in Europe or the Americas. This extra transit time directly translates to higher bunker fuel consumption, higher charter costs, and delayed deliveries.
Second, oil from Saudi and UAE wells routed to Red Sea terminals via internal pipeline systems (not via Hormuz) can be directly loaded onto tanker vessels at Red Sea ports, then sail north through the Suez Canal toward customers in Europe and America. For cargo destined for Asia, this option is less efficient, but for the Mediterranean and North Atlantic markets, it becomes the primary choice.
Saudi Aramco, for instance, has the Yanbu terminal in the Red Sea connected to a pipeline system from oil fields in eastern Arabia. This route, which was previously used as reserve capacity, suddenly became the primary export route. Tankers loading at Yanbu sail north, pass through Suez, and this is what drives the canal's statistics up dramatically.
Route Comparison: Distance, Time, and Cost Logic
The difference between the Suez route and the detour via the Cape of Good Hope is not merely a matter of distance. Every additional nautical mile means bunker fuel, crew costs, charter costs, and insurance premiums. For a Very Large Crude Carrier (VLCC) with capacity around 2 million barrels loading from a Saudi port, the comparison is as follows:
| Route | Origin | Destination | Approx. Distance (nm) | Est. Transit Time |
|---|---|---|---|---|
| Via Suez Canal (from Red Sea) | Yanbu, Saudi Arabia | Rotterdam, Netherlands | approx. 6,500 | approx. 15 days |
| Via Cape of Good Hope | Ras Tanura (Gulf) | Rotterdam, Netherlands | 17,000+ | 35-40 days |
| Via Suez Canal (from Red Sea) | Yanbu, Saudi Arabia | Houston, US | approx. 8,500 | approx. 20 days |
| Via Cape of Good Hope | Ras Tanura (Gulf) | Yokohama, Japan | approx. 13,000 | 28-30 days |
| SUMED Pipeline (canal bypass) | Ain Sukhna | Sidi Kerir, Mediterranean | Direct pipeline route | No sea transit |
Distance and transit time figures are general estimates based on standard navigation routes. Specific charter cost data is not available from the sources cited.
From the table above, it is clear: for European destinations, the Red Sea-Suez route is far more competitive than routing around Africa. Oil previously loading at Ras Tanura and sailing directly east is now operationally reconfigured. It is first pumped to Red Sea terminals via pipeline, then reloaded onto tankers sailing via Suez. This is not a cheap or simple operation. Pipeline transfer and reloading add time and cost at the terminal. But compared to sailing thousands of additional nautical miles via the Cape of Good Hope, the math still makes more sense for European and Mediterranean destinations.
Suez Canal Authority: Windfall from Others' Crisis
For the Suez Canal Authority, the closure of Hormuz is a bittersweet irony that proves profitable. After a difficult period in 2023-2024 when Houthi attacks in the Red Sea forced many operators to choose the Cape of Good Hope route to avoid security risks, the situation has now completely reversed. Hormuz closure makes the Suez route the only logical choice for most Middle Eastern energy cargo heading to Europe and the Mediterranean.
Each VLCC tanker passing through the Suez Canal pays a toll determined by deadweight tonnage and cargo capacity. The 28% surge in tanker transits directly translates to a significant increase in toll revenue for the Egyptian government. In the context of Egypt's fiscal stabilization efforts, this becomes a welcome windfall.
More broadly, this surge also benefits port services businesses, bunker fuel suppliers, ship pilot services, and the entire industrial ecosystem surrounding the Suez Canal at Port Said and Suez City.
Winners and Those Bearing the Largest Costs
Who Benefits
Red Sea terminal operators. Terminals like Yanbu (Saudi Arabia) and Fujairah (UAE) suddenly became critical nodes in the global energy supply chain. Throughput volume surges, infrastructure utilization increases, and terminal revenues rise. Fujairah especially benefits from its position as a storage and blending hub with land access from Abu Dhabi and Dubai, plus substantial storage capacity.
Tanker shipping companies operating the Red Sea-Mediterranean route. Sudden demand for tankers operating on this route drives daily charter rates upward. Operators who positioned their fleets on this route before the crisis are in a highly advantageous position. Companies like Euronav, Frontline, and DHT Holdings operating in the VLCC and Suezmax segments immediately became the focus of shipping analysts.
Egypt and the Suez Canal Authority. Toll revenue rises directly with volume. This also strengthens Egypt's bargaining position in bilateral negotiations with Gulf energy exporters and sends positive signals to Egyptian sovereign bonds.
Marine insurance and brokers. Increased route complexity, expanded exposure, and the need to reassess risk post-Hormuz crisis create extra work volume for the insurance and maritime brokerage industries in London's Lloyd's, Hamburg, and Singapore.
Who Bears the Costs
Far East Asian oil importers. Japan, South Korea, and Taiwan import much of their Middle Eastern oil, which previously passed through Hormuz. With Hormuz closed, there is no pipeline connecting to Red Sea terminals and then sailing to Asia, so the Cape of Good Hope route becomes the primary option with far higher costs.
Qatar LNG producers exporting to Asia. Qatar is the world's largest LNG exporter, and nearly all of its LNG carrier fleet passes through Hormuz to reach Asian markets. The closure forces these vessels to take a much longer detour, substantially increasing the cost per cargo.
European refineries dependent on Gulf crude. Although there is a shorter route via Suez, tanker availability in the Red Sea is not perfectly elastic. Suddenly diverted volumes create bottlenecks at terminals, long queues at the canal, and higher insurance premiums across the entire segment.
Infrastructure That Suddenly Became Strategic
The closure of Hormuz elevates the profile of several infrastructure assets that have long remained in the shadows:
Saudi Arabia's East-West Pipeline (Petroline). A large-capacity pipeline carrying oil from Saudi Arabia's eastern fields to the Yanbu terminal in the Red Sea. Under normal conditions, this pipeline operates below full capacity. The 2026 crisis pushes its utilization close to maximum limits.
SUMED Pipeline. A pipeline carrying oil from Ain Sukhna on the Red Sea to Sidi Kerir on the Mediterranean, running parallel to the Suez Canal. SUMED becomes crucial when the Suez Canal itself becomes congested and certain cargo needs to bypass the waterway.
Fujairah Terminal, UAE. Although geographically close to the Hormuz entrance, Fujairah has land access from Abu Dhabi and Dubai, plus substantial storage capacity. This terminal becomes a transit and blending hub intensely busy in the midst of crisis.
Market Signals and Equity Investor Implications
The Suez Canal traffic surge is not just logistics news. It is a signal readable by equity investors across multiple segments simultaneously.
Tanker shipping companies. In a tanker cycle already in its upcycle phase, the closure of Hormuz becomes a demand accelerator. VLCC and Suezmax companies operating the Red Sea-Mediterranean route immediately enter analyst radar. Spot rates for these specific routes rise as demand outpaces supply, unable to be filled merely by shifting fleets from Far East Asia routes that are now also congested.
Infrastructure plays in Saudi Arabia and Egypt. The Suez Canal is not traded on public stock exchanges, but it sends positive signals to Egyptian sovereign bonds and investor confidence in the nation's fiscal stability. In Saudi Arabia, high Petroline utilization strengthens the long-term investment case for midstream infrastructure.
LNG shipping. LNG carriers operating from Qatar via Cape of Good Hope face rising operational costs, but the shortage of LNG supply in European markets creates a price premium on the end-user side. This arbitrage benefits energy traders already holding long-term contracts at locked-in prices.
Reinsurance and marine insurance. The surge in volume on the Red Sea and Suez routes, along with re-priced risk premiums post-Hormuz crisis, increases the premiums that can be collected by Lloyd's of London and global reinsurance operators. Traffic concentration on a single alternative route also means exposure concentration, something that does not escape underwriter attention.
Structural Pressures That Cannot Be Ignored
- Hormuz reopening faster than estimated will reverse traffic flows and compress tanker rates on the Red Sea-Suez route.
- Congestion at the Suez Canal can limit actual throughput despite high demand for transits, creating long queues at Port Said.
- Escalating conflict that spreads to the Red Sea could close the Suez route itself, a precedent that already occurred during Houthi attacks in 2023-2024.
- Longer-term demand shifts if Asian importers accelerate diversification of energy sources away from the Middle East (US, West Africa, Australia).
One thing needs to be stated clearly by anyone trying to monetize this surge in Suez traffic: the situation rests on the assumption that Hormuz remains closed long enough to justify medium-term logistics reconfiguration.
If Hormuz reopens sooner than expected, some cargo currently detouring via Suez will revert to the direct Hormuz route. Tanker rates will correct. Red Sea terminals will return to normal utilization. Conversely, if the closure persists, pressure on canal capacity and supporting infrastructure will become increasingly acute.
The Suez Canal itself has physical limitations: width, depth, and the capability of its traffic management system that cannot be expanded overnight. With 1,182 ships in one month and a rising trend, questions about queuing, congestion, and waiting times at Port Said become operationally relevant. Long queues at the canal entrance could dampen some of the benefits that should come from route diversion.
There is also a broader geopolitical dimension. A Hormuz closure, whatever its specific cause, signals regional instability that affects the entire energy market's risk premium. When a choke point this large becomes blocked, the market does not stop at route calculation: crude oil price volatility, inflation impact, and central bank policy response in importers all become variables moving in concert. Investors buying only the "Suez up, buy tankers" thesis without considering these dimensions will find that geopolitical trades are rarely as simple as headlines suggest.
The figure 529 tankers in one month is a snapshot of a single moment. The logistics structure formed behind it, who owns the pipelines, terminals, and fleet positioned correctly, that is what determines who truly captures long-term gains from the largest route shift in 21st-century global energy history.
Share Article
Share
Disclaimer
All content presented in this article is for informational purposes only and should not be considered as financial advice. The author and publisher are not licensed financial advisors. Any investment decisions made by readers are personal choices, and all risks are solely borne by the reader. We strongly recommend conducting independent research and consulting with a licensed financial advisor before making any financial decisions.